
Do More People Drink Coffee or Tea Worldwide? Global Data
More people drink coffee worldwide when measured by total volume consumed. According to the USDA’s 2023 forecasts, global coffee consumption hit 10.038 billion kilograms, compared to 6.7 billion kilograms of tea. The confusion arises because tea is drunk by more individuals in the world’s most populous countries, but coffee drinkers consume more beverage by weight per person.
Most articles get this wrong because they conflate two different metrics: the total number of drinkers and the total volume of liquid consumed. They repeat the “tea is more popular” line without checking the primary source data from agricultural agencies. That omission leads to a consensus answer that doesn’t hold up to the numbers.
Let’s break down the official USDA data, convert the different units they use, and see what the global beverage landscape really looks like. The answer depends entirely on whether you’re counting cups or kilograms.
Key Takeaways
- Coffee wins on total volume: The world consumes about 10 billion kilograms of coffee annually versus 6.7 billion kilograms of tea.
- Unit conversion is critical: The USDA reports coffee in 60-kilogram bags and tea in metric tons. You must convert both to kilograms (kg) for a true comparison.
- Population skews the “drinkers” metric: While more individual people may drink tea, this is largely due to massive consumption in populous nations like China and India.
- Per-capita leaders drink coffee: Nations with the highest consumption per person, like Finland and Norway, are overwhelmingly coffee-drinking countries.
- The “more popular” claim is a semantic trap: “Popular” can mean more widespread (tea) or more intensely consumed by volume (coffee). The data supports coffee for volume.
What the Official USDA Data Says
Forget blog posts and infographics. The definitive answer comes from primary source reports published by the United States Department of Agriculture (USDA) Foreign Agricultural Service. Their annual “Coffee: World Markets and Trade” and “Tea: World Markets and Trade” reports are the gold standard for global agricultural commodity data.
The 2023 reports provide the following forecasts for consumption:
* Coffee (2022/23): 167.3 million 60-kilogram bags consumed worldwide.
* Tea (2022): 6.7 million metric tons consumed worldwide.
You cannot compare these numbers directly. One uses bags, the other uses tons. This is where most casual analyses fail. They’ll cite the 167 million figure against the 6.7 million figure and declare tea the winner because 6.7 is a smaller number. That’s mathematically meaningless.
The USDA’s “Coffee: World Markets and Trade” report (October 2023) forecasts world coffee consumption at 167.3 million 60-kilogram bags for the 2022/23 period. The companion “Tea: World Markets and Trade” report forecasts global tea consumption at 6.7 million metric tons for 2022. These are the primary-source figures any comparison must start from.
To compare them, you must convert both to a common unit: kilograms.
1. Coffee: 167.3 million bags × 60 kg per bag = 10,038,000,000 kg (10.038 billion kg).
2. Tea: 6.7 million metric tons × 1,000 kg per metric ton = 6,700,000,000 kg (6.7 billion kg).
The result is clear. By total weight of dry commodity consumed, coffee leads by roughly 3.3 billion kilograms. That’s a significant gap. This volume-based answer is the most objective one for the question “do more people drink coffee or tea worldwide?” when “more” refers to the sheer mass of the beverage produced and drunk.
TL;DR: Convert the USDA’s data to a common unit (kilograms). The world consumes about 10 billion kg of coffee versus 6.7 billion kg of tea, making coffee the volume leader.
Per Capita vs. Total Volume: Why Both Answers Can Seem Right
The confusion stems from answering two different questions. Are we measuring the total bulk of the beverage, or the number of human beings who drink it? The data supports different winners for each.
Total volume favors coffee, as shown. Per-capita consumption, the amount drunk per person, also heavily favors coffee in specific regions. However, the total number of drinkers likely favors tea. This is a function of simple arithmetic and population distribution.
Common mistake: Assuming “more popular” means the same as “consumed in greater volume.” Popularity is about reach (number of drinkers), while volume is about intensity of use. The global data shows tea has wider reach, but coffee has greater volumetric intensity.
Finland consistently tops global per-capita coffee consumption charts, with the average Finn drinking over 10 kilograms of coffee beans per year. Norway, Iceland, Denmark, and the Netherlands follow closely. These are nations of intense, daily coffee rituals. The per-capita tea consumption in these countries is negligible by comparison.
Conversely, in the world’s two most populous countries. China and India, tea is the dominant daily beverage for hundreds of millions of people. The sheer size of these populations means the total number of individual tea drinkers worldwide is enormous. When you read a claim that “tea is drunk by more people,” this is the demographic reality behind it.
| Metric | Coffee | Tea | What It Means |
|---|---|---|---|
| Total Global Volume | ~10.0 billion kg | ~6.7 billion kg | More physical coffee is consumed worldwide. |
| Per-Capita Leaders | Finland, Norway, Iceland, Denmark | Turkey, Ireland, United Kingdom | The heaviest drinkers, per person, are in coffee countries. |
| Driver of “Drinkers” | Distributed across many mid-size nations | Mass consumption in China & India | Population concentration in tea-drinking regions inflates the “number of people” count. |
The semantic trap is in the word “more.” If you ask a data agency “which is consumed more?”, they report volume. If you ask a sociologist “which is drunk by more people?”, they might survey individuals. Our global beverage preferences are complex, and reducing them to a single winner oversimplifies a rich cultural picture.
How Brewing Methods Skew the Volume Comparison
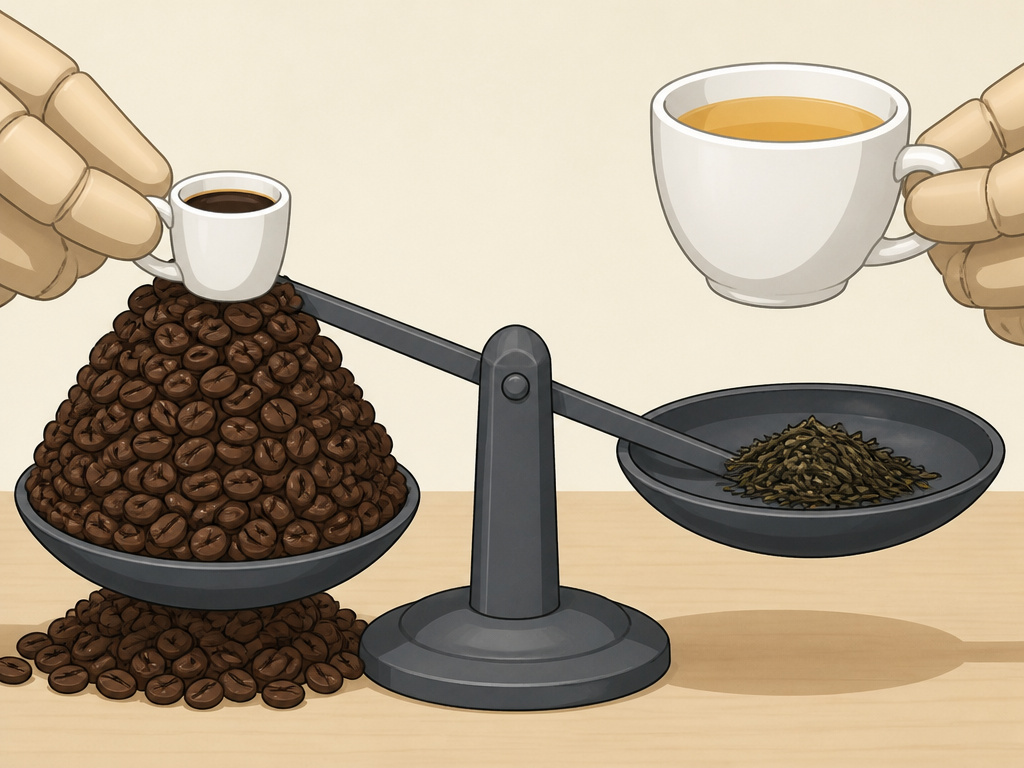
The volumetric data has another layer. A kilogram of coffee beans doesn’t produce the same amount of liquid as a kilogram of tea leaves. The brewing process and typical serving strength create a multiplier effect that makes coffee’s weight advantage even more pronounced in terms of actual cups drunk.
Coffee is an extraction. You use a relatively large mass of ground beans to produce a small, concentrated volume of liquid. An average espresso shot uses 7-9 grams of coffee for about 30ml of beverage. A typical filter coffee uses 15-20 grams for a 300ml mug. The dry bean-to-liquid ratio is high.
Tea is an infusion. You use a small mass of leaves to produce a large volume of liquid. A single gram of tea leaves can steep 200ml of water, and those leaves are often reused for multiple infusions in many cultures. The dry leaf-to-liquid ratio is low.
This means the 10 billion kilograms of coffee beans brews into an astronomical number of individual servings. The 6.7 billion kilograms of tea leaves stretches even further. But because coffee starts from a much larger base weight, the total volume of liquid coffee consumed globally is almost certainly higher. This brewing reality is a crucial brewing factor for caffeine and overall consumption that most comparisons ignore.
TL;DR: Coffee requires more dry product per cup than tea. Since we start with more kilograms of coffee globally, the total number of cups of coffee consumed is also likely higher, amplifying its lead.
Regional Champions: Where Coffee and Tea Rule
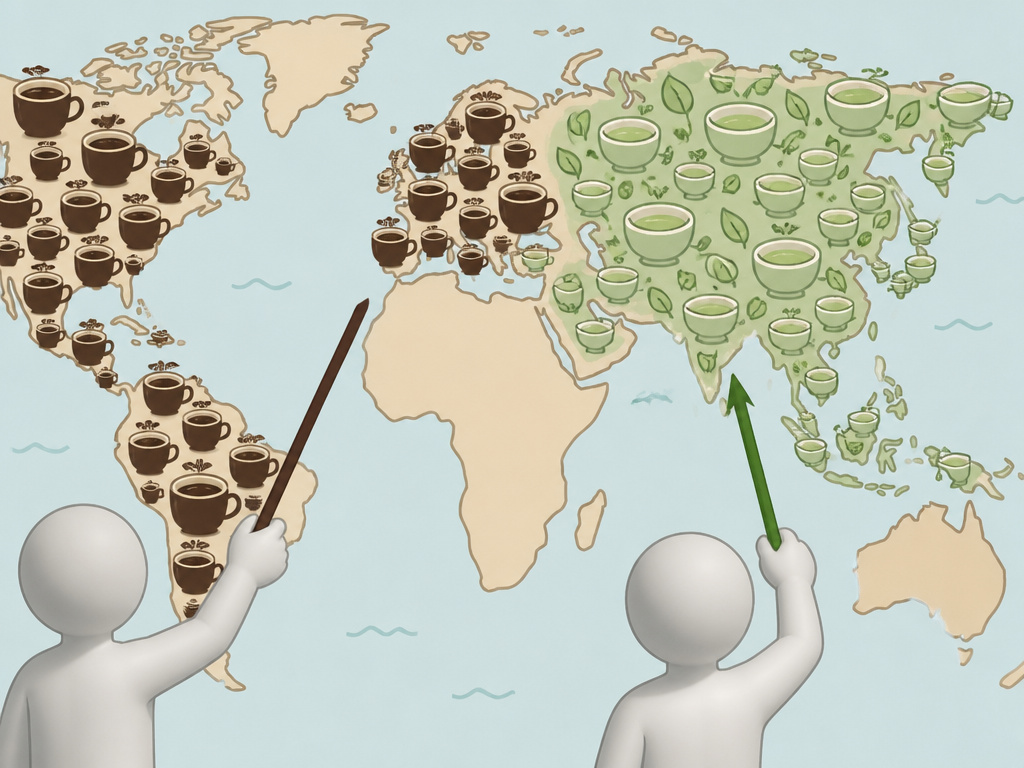
Geography is destiny in the coffee vs tea debate. Looking at a map of consumption reveals two distinct patterns: intensity versus breadth.
The Coffee Belt is about depth of habit. The Nordic countries, Western Europe, and North America have lower populations but extremely high consumption per person. Here, coffee isn’t just a drink; it’s a woven part of the daily social and work fabric. Brazil, a top producer, is also a massive consumer. The United States, while not a per-capita leader, consumes a staggering total volume due to its size.
The Tea Belt is about sheer scale. Asia is the undisputed heartland, led by China, the world’s largest producer and consumer of tea. India follows closely. Consumption in these countries is broad and deep across all demographics. Other significant tea cultures include Turkey, the United Kingdom, and the Middle East, where tea serves as a universal sign of hospitality.
I used to think tea’s lead was unassailable because of Asia’s population. Then I ran the USDA numbers. Seeing that 10 billion kg figure for coffee changed my mind. The Nordic habit isn’t just a stereotype; it’s a volumetric powerhouse that tips the global scales.
This regional split explains why personal experience is a terrible guide to the global answer. If you live in London, tea seems dominant. If you live in Seattle, coffee is king. An objective look requires setting aside anecdote for agricultural data. The Pew Research global beverage chart from 2013 remains a useful visual for these regional preferences, even if the underlying volume data has shifted.
Caffeine, Culture, and the Future of Consumption
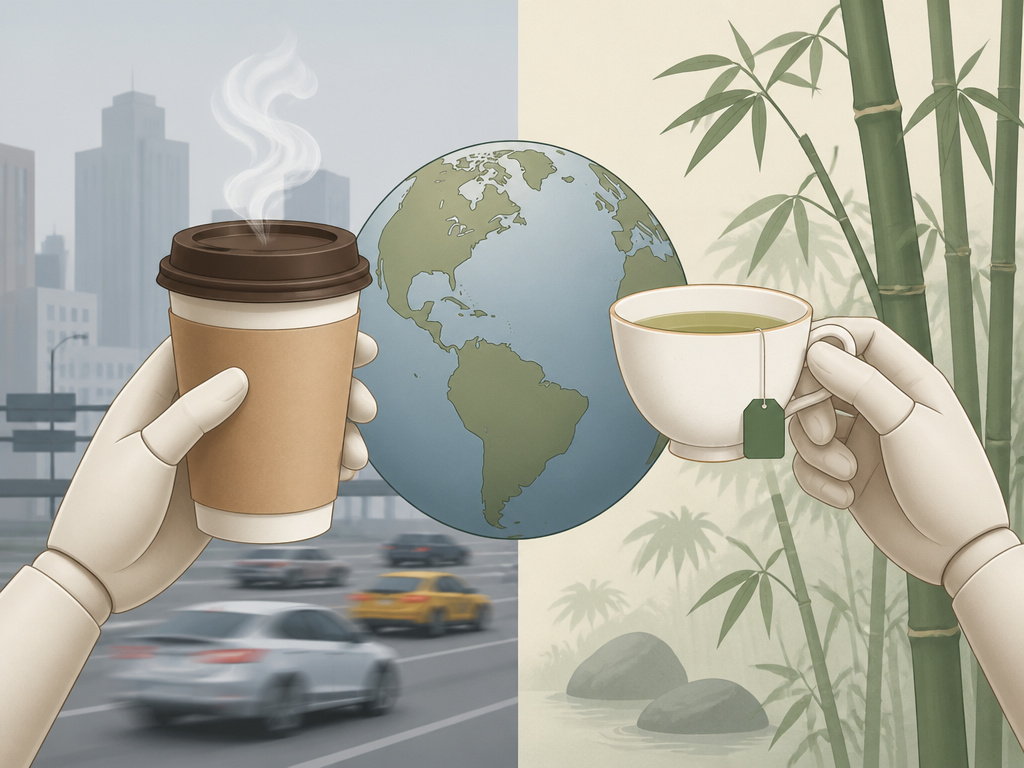
The debate isn’t just about quantity; it’s about character. The caffeine content comparison between the two beverages influences their roles. Coffee delivers a faster, sharper stimulant punch, aligning with fast-paced work cultures. Tea, particularly varieties like green tea, offers a more gradual caffeine release often attributed to the presence of L-theanine, promoting focused calm.
These profiles reinforce their cultural positions. The global rise of coffee shop culture, specialty brewing, and third-wave roasters has intensified coffee consumption in urban centers worldwide. Meanwhile, tea is experiencing its own renaissance with growing interest in premium loose-leaf varieties, matcha, and wellness-oriented herbal blends in Western markets.
Emerging markets will decide the future balance. As incomes rise in traditionally tea-drinking countries, will they adopt more coffee, as seen in parts of China? Or will economic growth simply allow for more premium tea consumption? The growth of energy drink consumption and other ready-to-drink alternatives also chips away at both traditional markets, complicating the picture further.
TL;DR: Coffee’s caffeine profile suits fast-paced cultures, while tea’s aligns with ritual and calm. Future trends in Asia and among younger generations will determine if coffee’s volumetric lead grows or if tea closes the gap.
Frequently Asked Questions
Does tea or coffee have more caffeine?
typical 8-ounce cup of brewed coffee contains about 95 mg of caffeine, while the same cup of black tea contains about 47 mg. Coffee generally has more caffeine per serving, but the exact amount varies hugely with brewing method, bean or leaf type, and serving size. For a deep dive, see our caffeine in black tea vs coffee analysis.
Which country drinks the most coffee per person?
Finland consistently ranks first in the world for per-capita coffee consumption, with the average person consuming over 10 kilograms of coffee beans annually. Other top countries include Norway, Iceland, Denmark, and the Netherlands.
Why do people say tea is more popular if coffee has higher volume?
They are using “popular” to mean “drunk by more individual people.” Due to massive consumption in highly populated nations like China and India, the total number of human beings who drink tea daily is likely larger than the number who drink coffee. However, the average coffee drinker consumes more beverage by weight than the average tea drinker.
Is tea consumption growing faster than coffee?
Growth rates fluctuate by year and region. Historically, global tea consumption has seen steady growth tied to population increases in Asia. The specialty coffee segment has seen explosive growth in the past two decades. For the latest trends, referring to the annual USDA reports is the most reliable method.
What about iced tea and cold coffee?
The iced tea popularity surge, especially in North America, and the global cold brew coffee trend are significant. These ready-to-drink and cold formats are major growth sectors that could influence future total volume statistics, particularly in warmer climates.
The Bottom Line
So, do more people drink coffee or tea worldwide? By the most concrete, measurable standard, total weight of the dry product consumed, coffee is the clear global leader. The USDA data converts to over 10 billion kilograms of coffee versus 6.7 billion kilograms of tea.
The persistent idea that tea is “more popular” stems from its unparalleled reach across the world’s most populous nations. More individual human beings probably sip tea daily. But the intensity of consumption in coffee-drinking cultures is so high that it wins the volumetric race.
The next time someone states the tea fact as absolute truth, ask them to check their units. The real story isn’t about one beating the other; it’s about how two different beverages have carved out massive, distinct territories in our global daily rituals. One wins on breadth of people, the other on depth of habit. The numbers, for now, side with depth.
